Assessing Altitude Adjustments in Multi-Stage Cycling Tours for Margin-Based Strategies
Viktor Lehmann · Aug 5, 2026
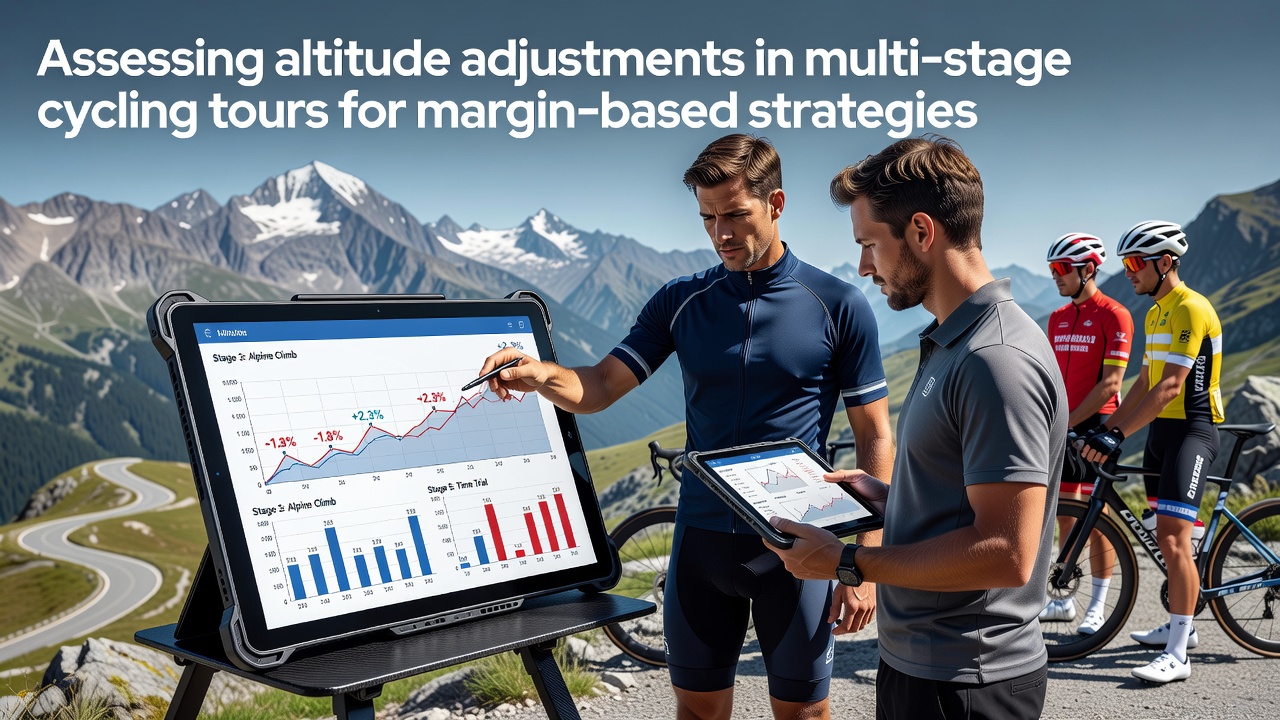
Assessing Altitude Adjustments in Multi-Stage Cycling Tours for Margin-Based Strategies
Multi-stage cycling tours present unique challenges for performance analysis because altitude directly influences power output, oxygen uptake, and recovery rates across successive days of competition. Researchers have documented consistent reductions in maximal aerobic power at elevations above 1500 meters, with studies indicating drops of 6 to 8 percent for every additional 1000 meters gained. These physiological responses create measurable shifts in stage outcomes that influence how operators calculate margins for betting markets on overall classifications and individual stage results.
Physiological Data Patterns Across Elevation Profiles
Performance databases compiled from events such as the Giro d'Italia and Vuelta a España reveal that riders experience acute declines in threshold power when stages climb above 2000 meters. Data collected during the 2025 season showed average reductions of 12 to 15 percent in sustained output compared with sea-level efforts, while repeated high-altitude days compound fatigue through slower glycogen replenishment. Analysts track these variables using power meters and heart-rate telemetry, then feed the figures into models that adjust probability distributions for margin calculations.
Teams have observed that acclimatization periods of 10 to 14 days mitigate some losses, yet not all riders follow identical preparation schedules before August events. The 2026 Vuelta a España, scheduled to begin in late August, features multiple summit finishes above 2500 meters, prompting operators to incorporate elevation-specific adjustments into their pricing algorithms well in advance of the opening stage.
Integrating Altitude Metrics into Margin Frameworks
Margin-based strategies rely on precise probability estimates that account for external variables including weather, course difficulty, and physiological stressors. Altitude enters these frameworks through regression models that weight historical stage results against current rider form and elevation gain. Operators who apply such adjustments narrow their overround by refining implied probabilities for favorites and outsiders alike.
One approach involves segmenting stages into low, medium, and high-altitude categories before recalibrating expected time gaps. Figures from the Union Cycliste Internationale show that time gaps between top-10 finishers widen by an average of 45 seconds per 1000 meters of elevation in high-altitude mountain stages compared with rolling terrain. These expanded margins allow operators to set tighter spreads while maintaining target profit percentages.

Case Examples from Recent Tours
During the 2024 Giro d'Italia, stages crossing the Stelvio and Mortirolo passes produced larger-than-expected time gaps that deviated from sea-level projections. Post-race analysis by sports science groups indicated that riders who had completed pre-race altitude camps maintained closer gaps to the leaders, whereas those without such preparation lost additional minutes. Operators who had layered these variables into their models recorded more stable margins across the three-week period.
Similar patterns emerged in the 2025 Tour de France when the race reached the Pyrenees. Data released by the Australian Institute of Sport highlighted that individual time-trial performances at 1600 meters showed 7 percent slower average speeds than comparable efforts at 500 meters. Bookmakers who referenced these benchmarks adjusted their stage-win odds accordingly and reported reduced variance in settlement outcomes.
Modeling Techniques and Data Sources
Advanced statistical packages now incorporate real-time barometric readings alongside rider power profiles to generate dynamic margin updates during live stages. These systems draw on datasets from national federations and academic research centers across multiple continents, including reports issued by the Canadian Sport Institute and European cycling laboratories. Continuous refinement of these models allows operators to respond to emerging patterns without widening their overall overround.
Researchers continue to examine interactions between altitude and other factors such as heat stress and hydration status, since combined stressors produce non-linear performance declines. Updated coefficients derived from 2025 season telemetry are already being tested ahead of the 2026 campaign to ensure pricing remains aligned with observed outcomes.
Conclusion
Altitude adjustments form an essential component of margin management in multi-stage cycling tours because elevation produces predictable, quantifiable effects on rider output and race dynamics. Operators who integrate physiological datasets, historical stage results, and real-time environmental measurements maintain tighter control over their pricing structures. As the 2026 Vuelta a España approaches with its demanding high-mountain program, continued refinement of these assessment methods will determine how accurately margins reflect actual competitive conditions across successive stages.