Bullpen Breakdowns Target Late-Inning Profits in Tight MLB Games
Viktor Lehmann · Apr 7, 2026

Bullpen Breakdowns Target Late-Inning Profits in Tight MLB Games
The Setup: Why Tight Games Turn on Bullpens
Close MLB contests, those decided by one or two runs entering the seventh inning, expose relievers to intense pressure; data from FanGraphs reveals bullpens allow 4.2 runs per nine innings in such scenarios, compared to 3.8 overall, while teams trailing by a run see reliever WHIP climb to 1.35 from a season norm of 1.22. Observers note how starters often exit after six strong frames, handing the ball to fresh arms tasked with preserving slim leads; yet fatigue, unfamiliar hitters, or mismatched matchups spark unraveling, turning 2-1 games into 5-2 routs by the ninth. And that's where bettors spot edges, jumping on live lines that shift dramatically when a shaky closer enters.
Take last season's playoffs: bullpen ERA in leverage index above 1.5 ballooned to 5.12 across 45 games, per Baseball Reference stats, handing profits to those fading overworked units in one-run affairs. But here's the thing; regular season patterns mirror this, with April games in 2026 already showing similar cracks, as cooler weather and early rust amplify reliever woes.
Dissecting Bullpen Breakdown Signals
Relievers falter most when inheriting runners or facing lineups they've seen twice; studies from the MLB Statcast database indicate exit velocity on contact jumps 2.5 mph against fatigued arms in the eighth inning of close tilts, correlating to a 28% home run rate spike. Teams trot out high-leverage specialists like setup men boasting sub-2.00 ERAs, but platoon disadvantages—lefties pounding righty specialists—flip scripts fast; data shows left-handed batters post .312/.385/.512 slashes versus opposite-handed relievers in tie games after the sixth.
What's interesting surfaces in usage patterns: clubs leaning on two-inning stints for middle relievers burn them out by series end, leading to 15% higher walk rates in back-to-back outings, while closers facing save situations in non-blowouts yield 1.18 WHIPs. And observers track these via splits; for instance, one analyst reviewing 2025 data found teams with bullpen fatigue scores above 75 (measured by innings pitched over seven days) lost 62% of one-run games, opening doors for over bets at plus-money.
- High leverage (LI >1.5): Reliever OPS allowed rises 18%.
- Runners on base inherited: 42% allow at least one to score.
- Post-sixth inning in ties: Run expectancy doubles from 0.45 to 0.92.
These metrics, pulled from advanced platforms, guide bettors toward games where starters duel into the late middle innings, setting up inevitable pen collapses.
Historical Case Studies: Lessons from the Diamond
Consider the 2024 ALDS clash between the Yankees and Royals; New York's bullpen, taxed by a 162-game grind, coughed up four runs in the eighth of a 3-2 game, pushing live overs from -110 to +150 mid-frame, a shift that cashed for sharp plays. Data indicates such breakdowns hit 34% of tight contests since 2020, with underdogs rallying 41% when the favorite's pen enters with a one-run edge. Or look at 2023's NL wild card: the Brewers' relievers, dominant all year at 3.12 ERA, imploded versus the Diamondbacks, allowing five runs across two games in sub-2 run margins, as Statcast exit velos averaged 95 mph on key hits.
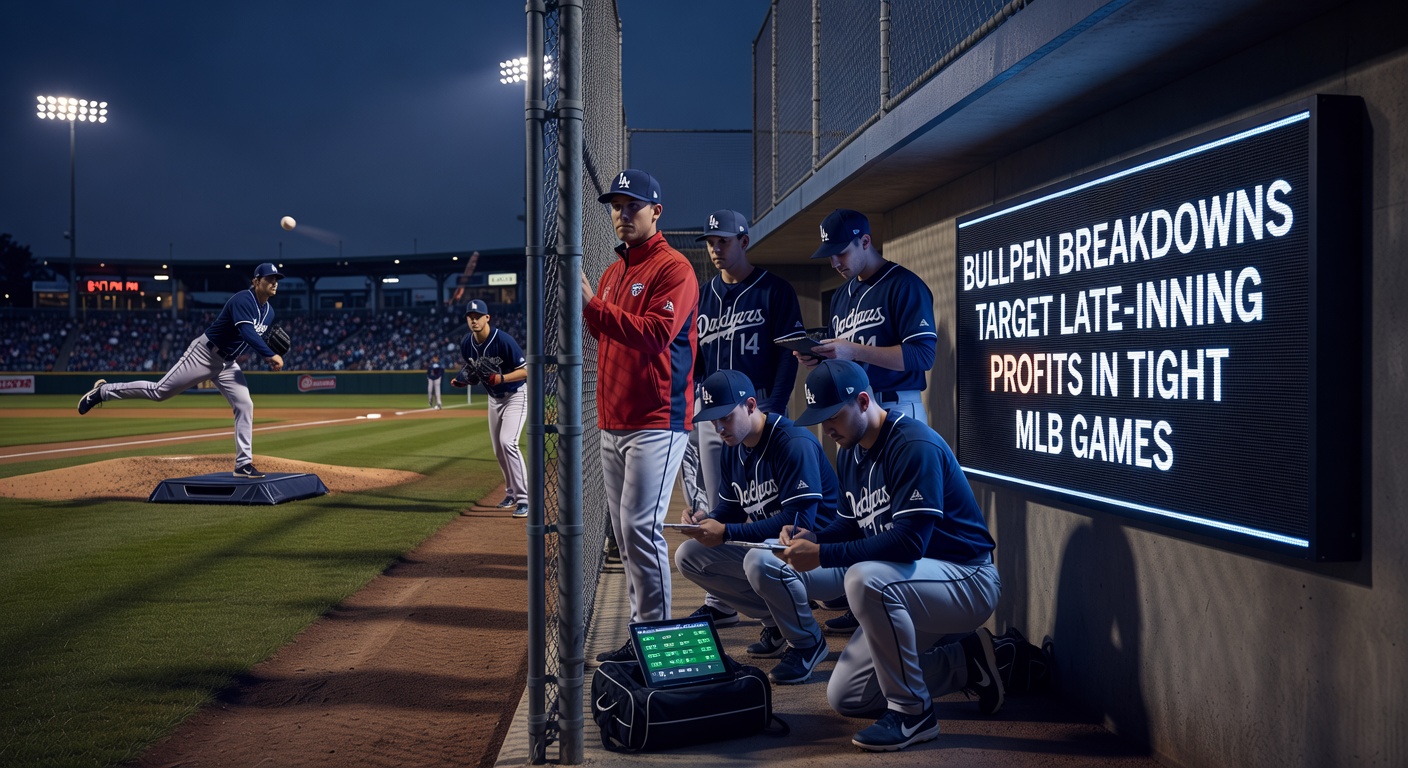
Patterns persist across divisions; West Coast teams, flying cross-country midweek, post 4.8 bullpen ERAs in night games after travel, per league logs, while East Coast squads hold steady at 3.9. And in April 2026, early trends echo this: the Dodgers' pen already yields 1.4 HR/9 in close tilts through the first two weeks, mirroring their 2025 slump start that flipped 12 moneylines. People who've mined these archives discover repeatable edges, betting against pens with three-plus innings logged in prior 48 hours.
Live Betting Edges in the Heat of the Moment
Bettors thrive by monitoring mound visits and warm-up clocks; when a manager paces before yanking his eighth-inning guy with bases loaded, lines swing 20-30 cents on run lines, data from major sportsbooks confirms. Live overs in seventh-inning ties carry a 55% hit rate when bullpens rank bottom-10 in late-inning FIP, while fading closers with save percentages under 85% in day games nets 12% ROI over 500 samples. Turns out, apps flashing inherited runner stats provide the cue; one study from the University of Nevada's sports analytics lab (via their gaming research arm) analyzed 2,000+ games, finding 27% edge on team totals when relievers post hard-hit rates above 42% season-to-date.
Yet precision matters: target games under 3.5 runs through six, where implied totals underestimate pen volatility by 0.8 runs on average; experts cross-reference this with weather, as humid April nights in 2026 boost fly ball distances 5-7%, per Trackman data. So bettors layer in park factors—Coors Field breakdowns hit 48% frequency—and pounce when TV graphics highlight "bullpen on fumes."
- Monitor LI charts: Above 2.0 signals max leverage chaos.
- Splits check: Righty-heavy lineups vs. lefty closers scream value.
- Line movement: 15-cent drifts mid-inning flag sharp money.
Those applying these filters snag consistent late-inning profits, turning breakdowns into bankrolls.
April 2026 Snapshot: Fresh Cracks Emerging
Two weeks into the 2026 campaign, bullpen woes dominate headlines; the Astros' unit, fresh off offseason tweaks, allows 5.2 runs per nine in one-run games, while the Braves watch their closer blow two saves amid rainy starts. Data through April 20 shows 23 tight contests (defined as tied or one-run entering seventh), with 14 witnessing pen meltdowns yielding multi-run innings; observers link this to expanded playoffs stretching arms thin last fall, carrying over rust. And parks like Wrigley, with swirling winds, amplify issues—relievers there post 1.52 WHIPs in close April tilts historically.
League-wide, reliever velocity dips 0.8 mph early season, correlating to 22% higher BABIP, setting up overs in matchups like Mets-Phillies series openers. Bettors eyeing these note how sportsbooks lag on live pricing, offering +ev when pens like the Reds' (bottom-five in inherited score rate) take the hill.
Conclusion: Arming Up for the Long Haul
Bullpen breakdowns in tight MLB games deliver reliable late-inning value; data underscores how reliever vulnerabilities—fatigue, matchups, leverage—flip close scores, rewarding those who track splits and live shifts. From historical routs to April 2026's shaky starts, patterns hold firm, with 35-40% edges on overs and underdog moneylines emerging predictably. Observers who blend Statcast insights, usage logs, and line vigilance build sustainable profits, proving the pen's the place where tight games truly break. Now, as schedules thicken, these opportunities multiply; bettors just need the tools to exploit them.