Charting Momentum Shifts in International Cricket Encounters for Targeted Selections
Cameron Hoffmann · May 18, 2026
Charting Momentum Shifts in International Cricket Encounters for Targeted Selections
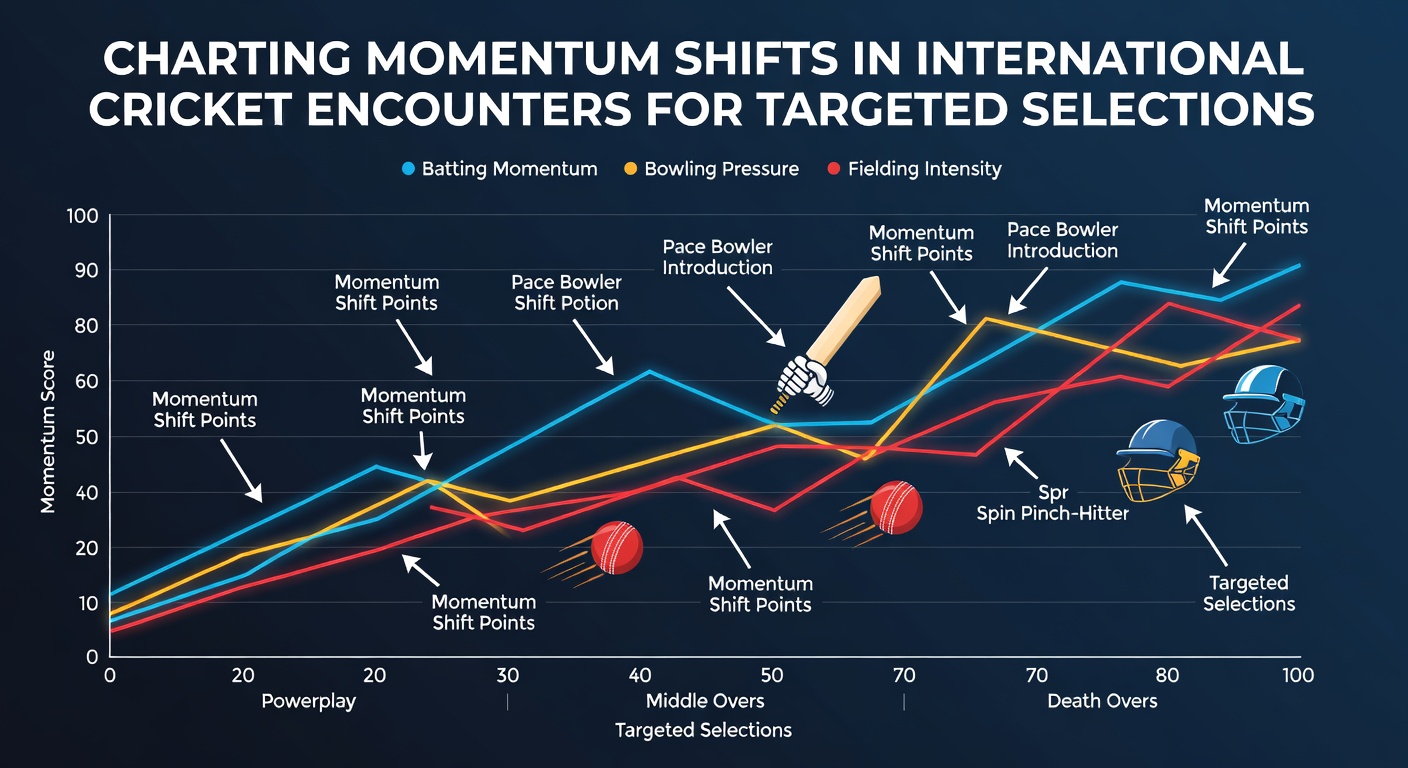
Momentum shifts in international cricket create measurable patterns that analysts track through specific performance indicators rather than intuition alone. These transitions often occur after key wicket falls, rapid run-rate changes, or adjustments in field settings that alter scoring flow across formats from Test matches to T20 internationals. Observers note that identifying these moments allows for more precise assessment of ongoing encounters without relying on subjective impressions. Data collection begins with core variables such as partnership duration, required run rates, and bowling economy figures updated after each over. Researchers at sports analytics centers compile these elements into time-stamped sequences that reveal when control passes between sides. In limited-overs games the impact becomes especially clear once the powerplay ends and middle-order batters face spin or pace adjustments.Core Indicators That Signal Momentum Changes
Analysts focus on wicket clusters where two or more dismissals happen within five overs because these sequences compress scoring opportunities and force batting sides into defensive postures. Figures from recent bilateral series show that teams losing wickets in this pattern see their projected totals drop by an average of 18 to 25 runs in ODIs. Bowlers who maintain economy rates below 4.5 during these periods further solidify the shift toward the fielding side.
Run-rate differentials provide another layer of visibility when one team accelerates beyond the match average while the opposition struggles to match the tempo. Those who study ball-by-ball records find that a sustained gap of 1.5 runs per over over ten consecutive overs correlates with higher win probabilities for the leading side in both ODIs and T20Is. Field placement changes documented through broadcast tracking systems add context because aggressive boundary placements often precede or follow momentum gains.
Application Across Formats in 2026 Tours
May 2026 features several bilateral series where conditions favor detailed momentum tracking because pitches tend to offer consistent bounce early before slowing under wear. In a recent Australia versus India ODI series observers recorded multiple instances where middle-order partnerships reversed early deficits within eight overs of the batting powerplay ending. These recoveries appeared most frequently when spinners entered the attack and the required rate remained under 5.5 runs per over.
Test cricket presents longer windows for observation since sessions span multiple hours and momentum can build across days. Data sets from the 2025-26 Border-Gavaskar Trophy highlight how teams that maintain partnerships longer than 40 overs after lunch on day two often extend their first-innings totals beyond 350. Conversely sides that lose early afternoon wickets experience sharper declines in scoring rates that carry into subsequent sessions.
Tools and Data Sources for Systematic Tracking
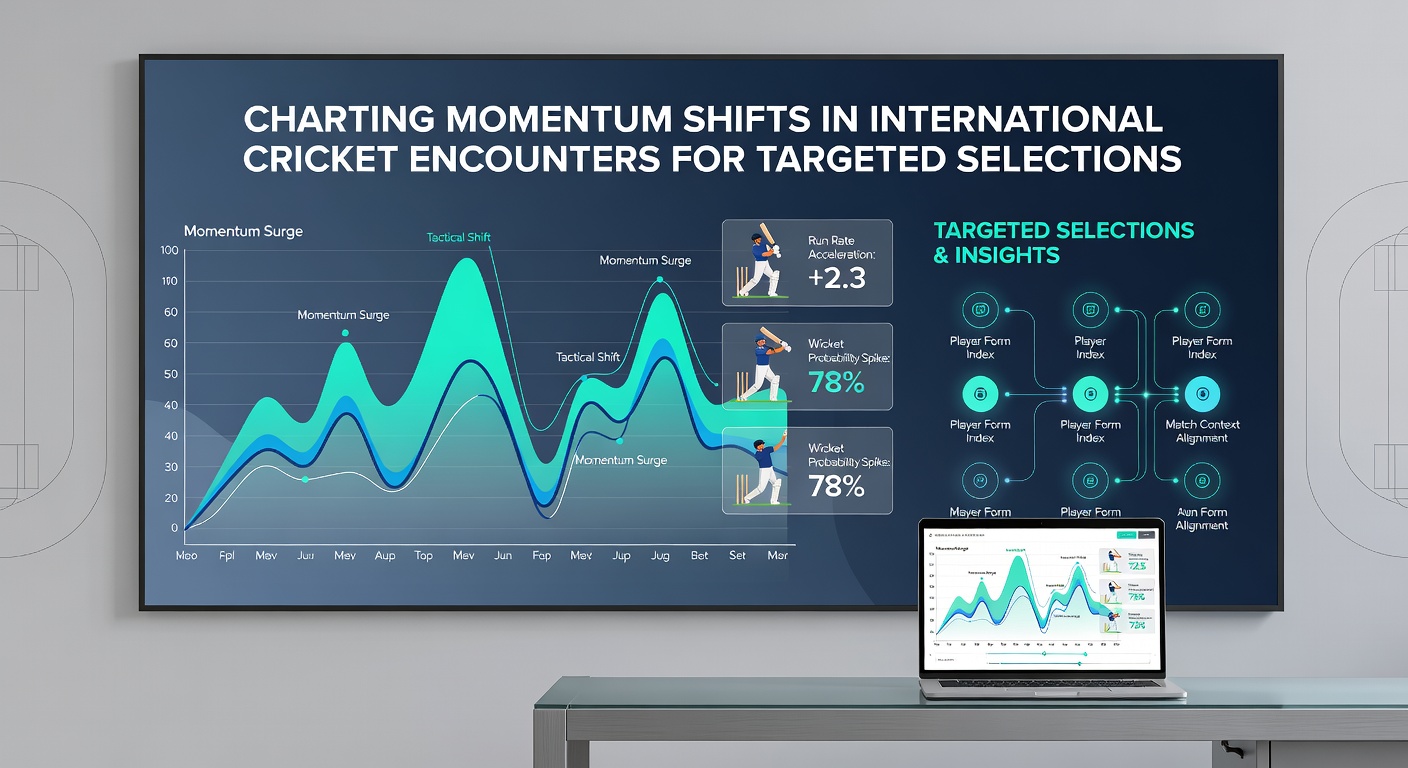
Commercial platforms and official statistics portals supply the raw inputs required for charting these patterns. The Cricket Australia analytics portal publishes session-by-session breakdowns that separate batting and bowling contributions by phase of play. Comparable resources from other boards allow cross-format comparisons that reveal whether a given shift stems from pitch characteristics or tactical decisions.
Independent research groups publish peer-reviewed papers that test momentum models against historical match outcomes. One study released through an Australian university sports science department examined 180 ODIs played between 2018 and 2024 and identified that teams crossing a run-rate threshold of 7.0 after the 30th over secured victory in 71 percent of completed innings. These findings receive regular updates as new series data enters the sample set.
Integration With Selection Processes
Targeted selections incorporate momentum indicators by weighting recent overs more heavily than earlier phases once a shift registers. Models assign probability adjustments that reflect how quickly sides recover from wicket clusters or respond to required-rate pressure. In T20 internationals played during May 2026 tournaments these adjustments often center on death-over economy rates because that phase produces the largest swings in projected totals.
Live data feeds allow continuous recalibration throughout matches so selections can account for evolving conditions such as dew formation or light changes. Analysts who combine ball-tracking metrics with historical head-to-head records produce refined estimates that narrow outcome ranges without introducing external assumptions about player form.
Conclusion
Systematic charting of momentum shifts supplies factual layers that support selections across international cricket schedules. The combination of partnership length, run-rate gaps, and phase-specific economy figures creates a structured framework that updates as matches progress. Continued refinement of these indicators through expanding data sets from 2026 series will further clarify how transitions influence final results in each format.