Correlating Pitcher Fatigue Metrics with Late-Game Run Line Outcomes in Extended MLB Series
Theo Baumann · Jul 8, 2026
Correlating Pitcher Fatigue Metrics with Late-Game Run Line Outcomes in Extended MLB Series
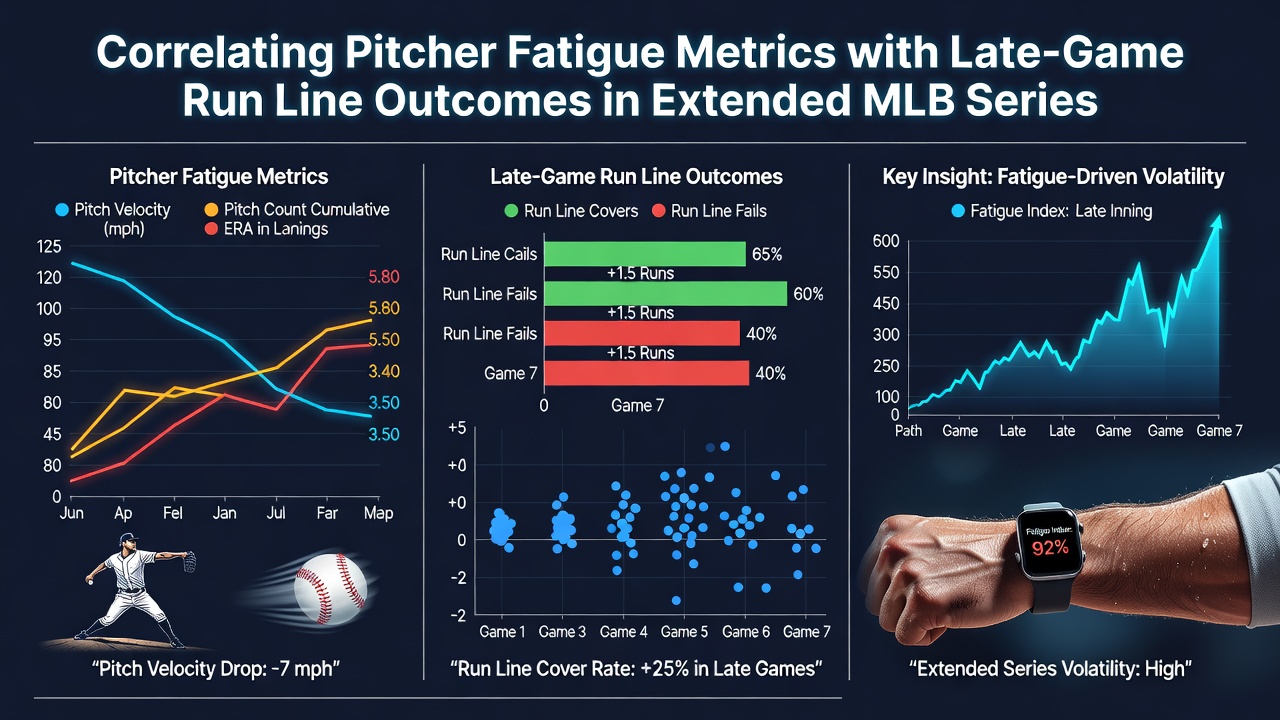
Extended MLB series often stretch pitchers beyond standard workloads, and analysts track several fatigue indicators to understand shifts in late-game run line performance. Pitch count totals, velocity drops across innings, and spin rate changes serve as primary markers that data aggregators monitor throughout a season, while researchers compile these figures from official box scores and tracking systems to map patterns against run totals in games that reach extra innings or late frames.
Key Fatigue Indicators in Professional Baseball
Velocity decline stands out as one measurable signal because starting pitchers who lose two or more miles per hour from their first-inning fastball averages tend to allow more hard contact in later frames, according to aggregated Statcast records. Innings pitched beyond six frames also correlate with rising walk rates, since command erodes when arm fatigue sets in, and observers note that these trends appear more pronounced during July when teams navigate dense schedules with limited off days.
Spin rate reductions provide another data point because decreased movement on breaking balls can turn borderline strikes into hittable pitches, and multiple research teams have documented how this metric drifts after the 90-pitch threshold in most starters. Teams that rely on analytics departments feed these numbers into real-time dashboards so managers can decide whether to pull a starter before run line margins widen.
Run Line Patterns in Prolonged Contests
Run lines in extra-inning games shift when bullpens enter earlier than planned, because fresh relievers often stabilize scoring while fatigued starters allow clusters of runs in the seventh through ninth innings. Data sets covering the 2024 and 2025 seasons show that teams whose primary starters exceed 100 pitches post higher opponent run totals after the sixth inning compared with outings that stay under that mark, and these outcomes directly influence both sides of a typical run line bet.
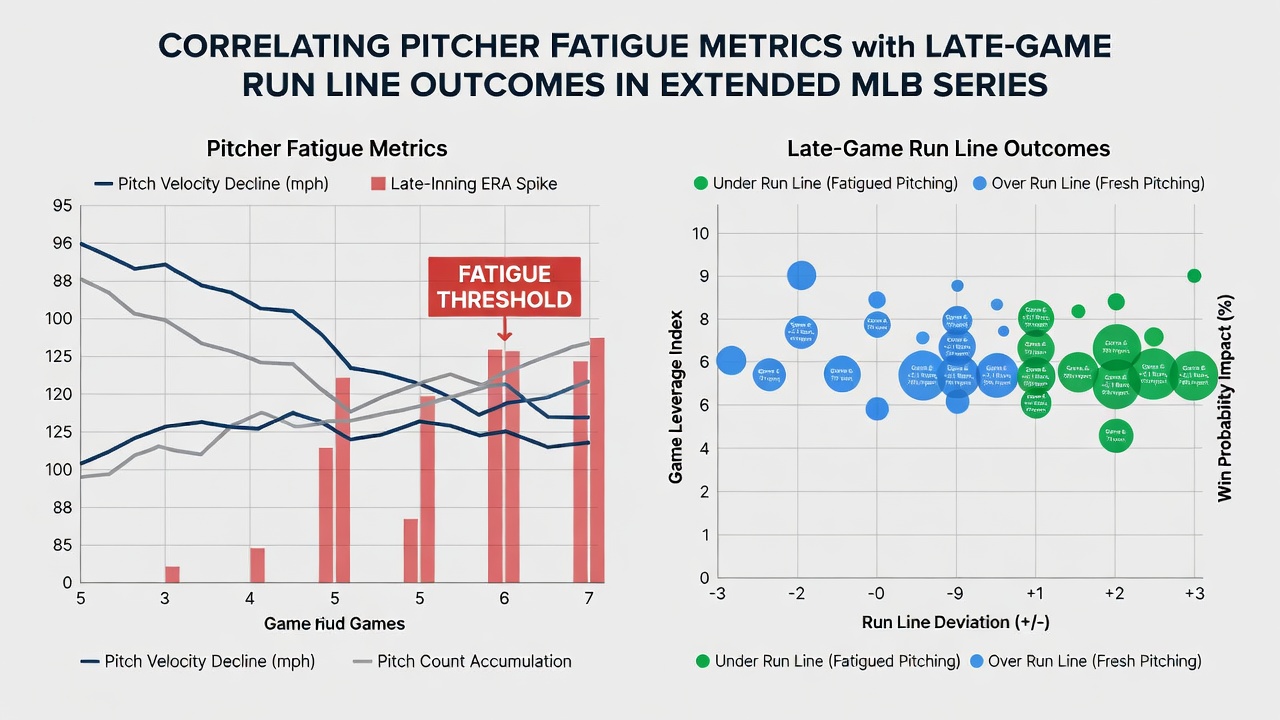
One analysis of 2025 postseason extended series highlighted how velocity loss above a 1.5 mph threshold aligned with increased run production in the final three innings, and similar patterns surfaced during regular-season doubleheaders when recovery windows shrink. Those who study workload management point out that recovery protocols between starts also affect how quickly pitchers regain velocity, which in turn shapes late-game margins.
Data Sources and Seasonal Tracking
MLB's official tracking systems supply granular pitch-by-pitch information that external researchers combine with injury databases to build fatigue models, and these models now incorporate variables such as days of rest and travel distance. As of July 2026, several front offices continue to refine algorithms that weigh cumulative pitch counts across a three-game set against projected bullpen effectiveness, because series that stretch into four or five games amplify the impact of any early workload spikes.
Society for American Baseball Research studies have compiled historical workload data spanning multiple decades, revealing that starters who log high pitch counts in the first game of a series show measurable declines in strikeout rates by the third contest. Additional work from academic groups tracks how these trends intersect with run line differentials when games extend past regulation.
Case Examples from Recent Seasons
During the 2025 campaign, several clubs observed that starters who maintained fastball velocity within 1 mph of their season average through 85 pitches limited opponent scoring in the eighth and ninth, which kept run lines closer to the pregame total. Conversely, outings marked by earlier velocity decay produced clusters of runs that pushed totals over the listed run line, and these sequences appeared most often in divisional series where travel demands limit recovery time.
Bullpen usage patterns also shift when fatigue models flag elevated risk, because managers insert specialized relievers earlier to protect margins, and this adjustment alters the run distribution in the later innings. Tracking services record these substitutions alongside pitch metrics so analysts can isolate the contribution of starter fatigue from overall team strategy.
Integration of Metrics into Game Planning
Front offices merge fatigue data with opposing lineup strength to set thresholds for starter removal, and these decisions frequently determine whether a game stays under or pushes over the run line. Pitchers who exhibit early spin rate drops receive shorter leashes in back-to-back starts, while those who hold velocity longer often complete deeper outings that reduce bullpen exposure and stabilize late scoring.
League-wide datasets now include granular rest metrics because cumulative workload across a homestand or road trip influences how sharply performance declines in extended frames. Teams that monitor these variables report fewer instances of late collapses when they align starter deployment with measured fatigue signals rather than fixed pitch counts alone.
Conclusion
Correlations between pitcher fatigue metrics and late-game run line outcomes emerge from consistent patterns in velocity, spin, and workload data across extended series, and ongoing collection efforts through 2026 continue to refine how these signals predict scoring shifts. Organizations that integrate multiple indicators into decision frameworks produce measurable differences in run totals once games reach the later innings, while historical reviews supply context for interpreting current season trends.