Referee Bias Metrics and Their Impact on NHL Puck Line Profitability
Cameron Hoffmann · Aug 10, 2026
Referee Bias Metrics and Their Impact on NHL Puck Line Profitability
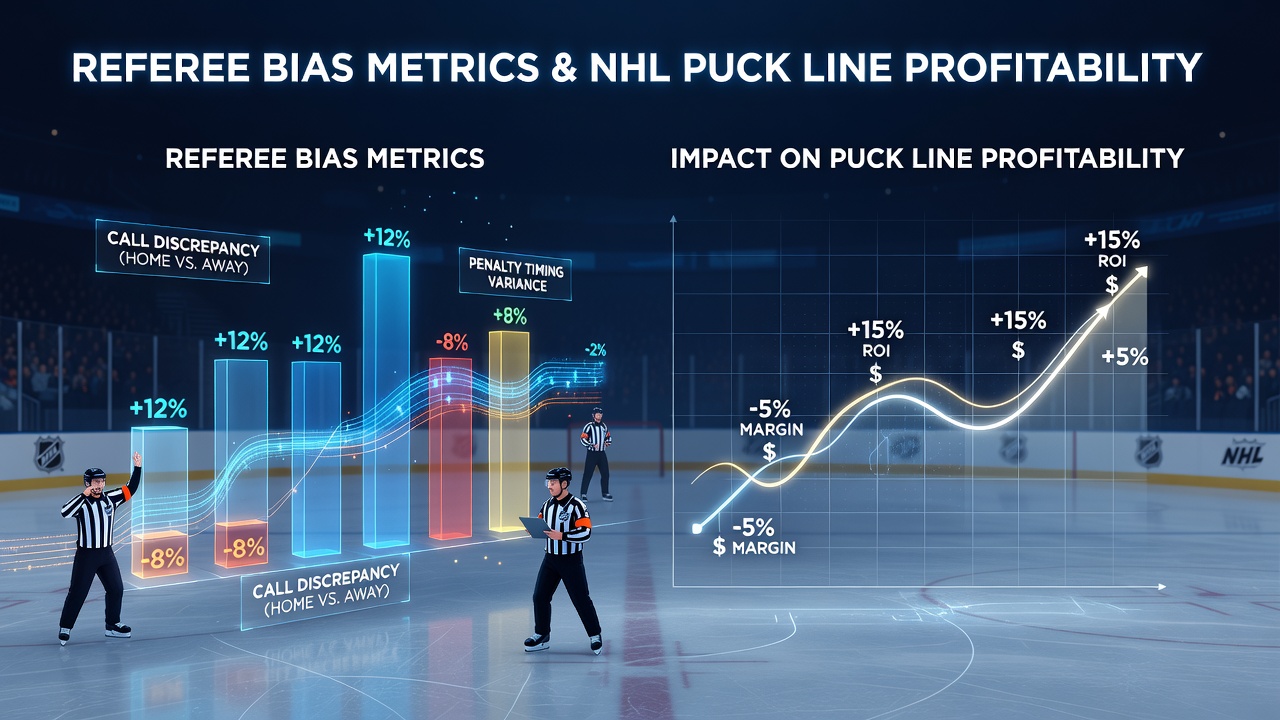
Referee bias metrics track systematic patterns in penalty calls, goal reviews, and game management decisions across National Hockey League contests, and these figures connect directly to puck line outcomes where bettors wager on whether a team will win by more than 1.5 goals or stay within that margin. Analysts compile data on home versus away penalty differentials, power play opportunities awarded after certain infractions, and consistency rates in overtime situations to identify measurable edges. The 2025-2026 regular season produced over 1,300 games, each generating detailed logs that researchers cross-reference with final scores to calculate how officiating tendencies shift expected goal margins.
Core Metrics Used to Quantify Bias
Observers calculate several indicators that include the home team penalty advantage ratio, which compares infractions called against visitors versus hosts across hundreds of matchups, along with the neutral zone infraction frequency that often precedes odd-man rushes. Additional measures examine the rate at which video reviews overturn on-ice calls in high-stakes periods, while separate indices track how specific referee crews handle physical play in rivalry games versus inter-conference matchups. These statistics come from official play-by-play files released by the league after every contest, and they allow modelers to adjust projected goal differentials before lines open.
Puck Line Structure and Sensitivity to Officiating
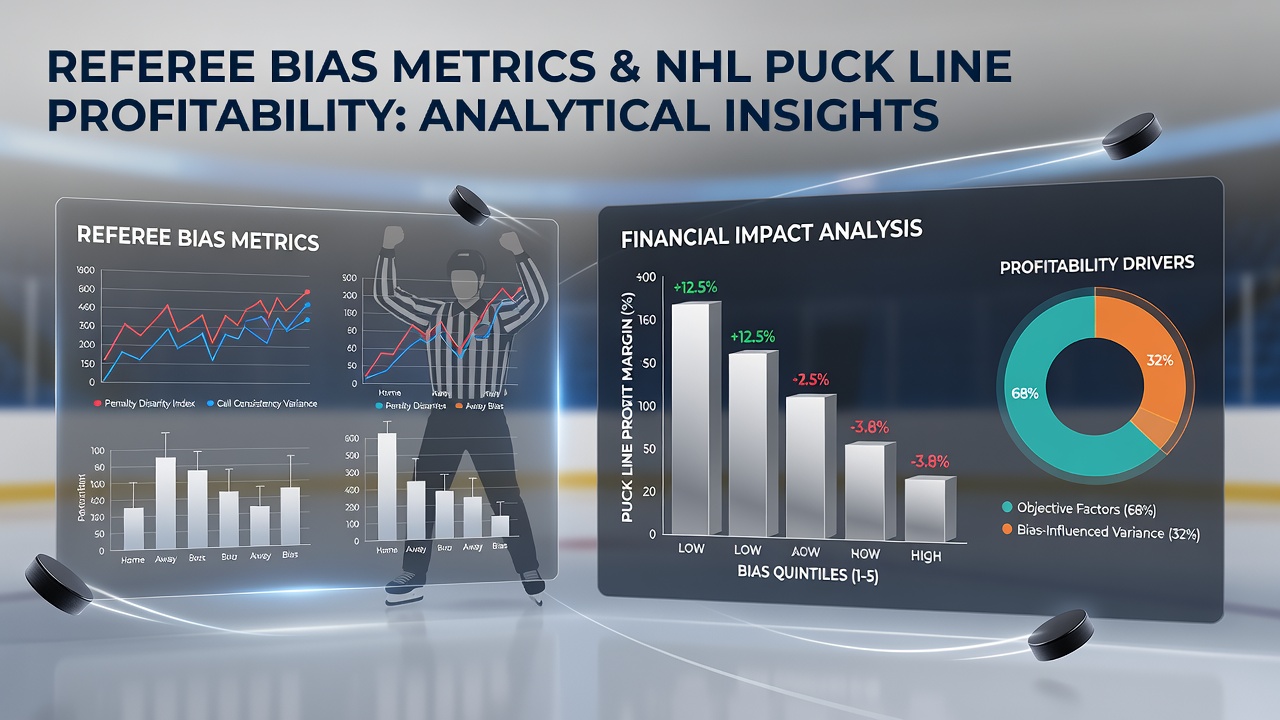
Puck line wagers require one side to prevail by two or more goals while the opposing selection covers when the margin stays at one goal or fewer, and even small shifts in power play time alter those probabilities measurably. When crews call more penalties on the road team during the second period, the home side gains extra five-on-four chances that frequently produce the second goal needed to push the margin past 1.5. Data compiled through the first three quarters of the 2025-2026 campaign showed crews with above-average home bias increased the home favorite's cover rate by roughly four percentage points on puck lines compared with crews rated neutral.
Seasonal Patterns Emerging in 2026
August 2026 brings the start of training camp preparations for the upcoming campaign, and front offices already review last season's referee assignment logs to forecast how certain crews might influence early schedule games. Teams traveling across multiple time zones in October face crews known for stricter enforcement on stick infractions, which tends to compress scoring chances and keeps more contests within the puck line margin. Historical files indicate that divisional games late in the season carry higher rates of make-up calls, a pattern that reduces the likelihood of blowout results and therefore affects underdog puck line profitability.
Integration with Betting Market Models
Quantitative groups incorporate referee bias coefficients into goal expectation formulas by weighting each crew's historical call distribution against the participating teams' styles of play, and these adjusted projections feed directly into puck line pricing algorithms used by sportsbooks. When the model detects a referee pairing that favors physical teams through fewer obstruction calls, the projected goal total rises and the favorite's cover probability increases accordingly. Public betting percentages often lag behind these refined estimates because bettors focus more on team records than on the specific officials assigned to a given night.
Geographic and Conference Variations
Eastern Conference games historically show larger home penalty advantages during the regular season, whereas Western Conference contests produce more balanced power play distributions according to multi-year aggregates released by the league. Canadian-based franchises experience different review overturn rates compared with U.S. clubs when games occur in arenas with distinct sightline configurations, a factor tracked in internal league reports. Bettors who layer these regional tendencies onto puck line selections can identify spots where the line movement does not fully reflect the officiating overlay.
External Research and Data Sources
Studies conducted by academic teams at institutions such as the Statistics Canada sports analytics division have examined how officiating consistency correlates with scoring variance across professional leagues, while industry reports from the National Hockey League official statistics portal supply the granular play-by-play data required for crew-level analysis. These sources allow independent researchers to replicate bias calculations without relying on proprietary models.
Conclusion
Referee bias metrics supply measurable inputs that refine puck line projections by accounting for systematic differences in penalty distribution and review outcomes across crews and conferences. As the league continues releasing detailed play-by-play information each season, quantitative approaches gain additional precision in isolating officiating effects from team performance variables. Market participants who integrate these figures into their evaluations encounter pricing discrepancies that persist when public attention remains fixed on broader team trends rather than crew-specific patterns.