Rest Day Advantages: Exploiting Recovery Metrics in EuroLeague Basketball Wagers
Ulrich Powell · May 29, 2026
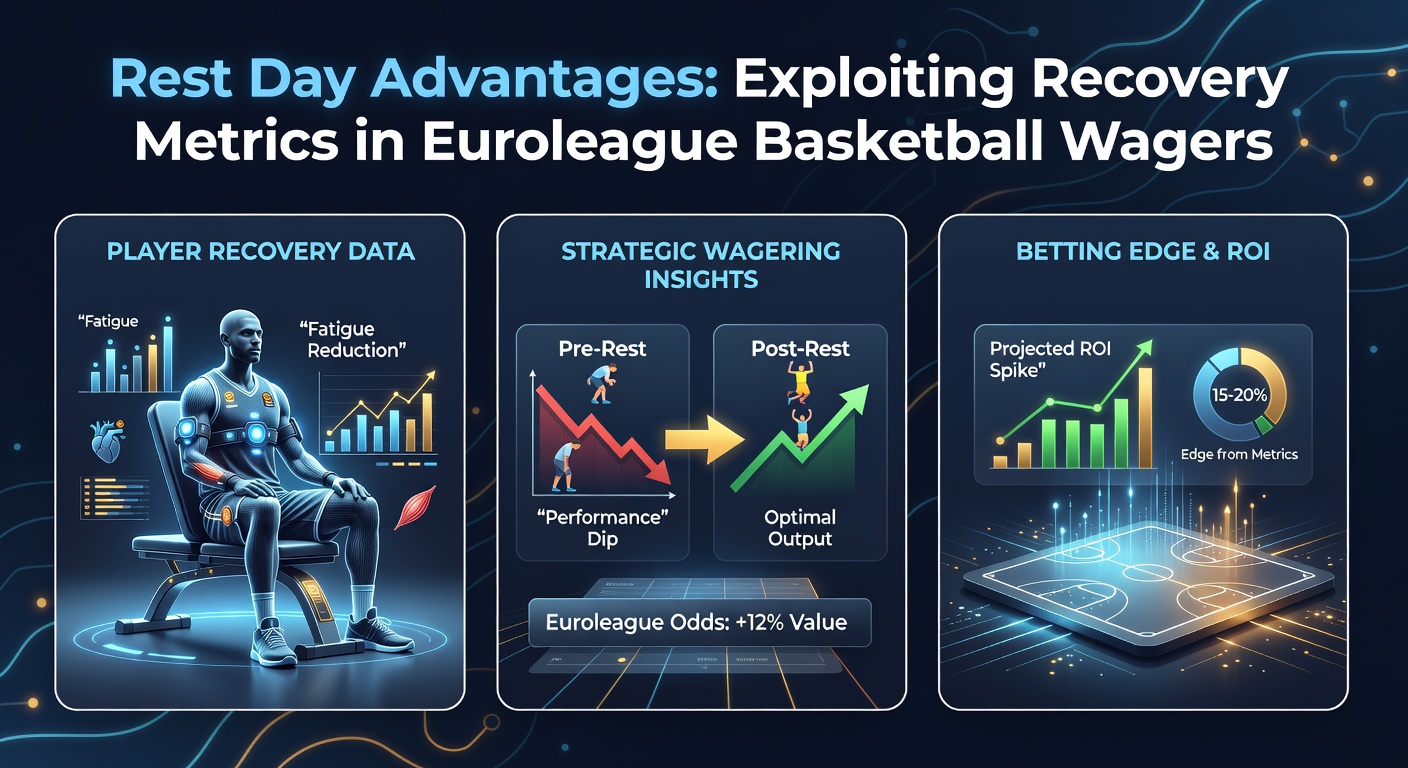
Rest Day Advantages: Exploiting Recovery Metrics in EuroLeague Basketball Wagers
EuroLeague schedules pack intense travel and consecutive games into tight windows, yet teams that secure extra rest days often display measurable edges in shooting efficiency and defensive intensity according to league tracking data. Recovery metrics such as heart-rate variability, sleep duration and neuromuscular readiness have become central to how analysts evaluate upcoming fixtures, particularly when lines move quickly after schedule releases. Observers note that squads returning from longer breaks frequently outperform market expectations in the opening quarter, where fresh legs translate directly into transition scoring and rebounding dominance.
Schedule Density and Its Measurable Impact
Teams in the 2025-26 campaign averaged 1.8 games per week during the regular season, with clusters of three contests in eight days appearing regularly through February and March. Data compiled by EuroLeague Basketball shows that clubs granted at least 72 hours between tip-offs recorded a 4.7 percent higher effective field-goal percentage than those playing on shorter turnarounds. Those margins widened further in road environments, where cumulative fatigue from flights compounds the physical load. Bettors who cross-reference published game calendars with team injury reports therefore identify spots where implied probabilities lag behind documented rest advantages.
Key Recovery Metrics Tracked by Performance Staff
Modern EuroLeague franchises deploy wearable technology that records overnight heart-rate variability and readiness scores each morning. Values above a player’s seasonal baseline correlate with improved three-point accuracy and reduced turnover rates in subsequent matches. Sleep-tracking rings supplied to rosters reveal that squads averaging above seven hours of quality rest per night post-travel maintain higher defensive rebounding percentages across multi-game weeks. Analysts incorporate these figures into models that adjust projected totals downward when both clubs enter a fixture with elevated recovery scores, producing clearer value on the under in certain matchups.
Case Patterns from Recent Seasons
One recurring pattern appears when a top seed finishes a homestand and receives four days before a midweek road game against a lower-table opponent. Historical box-score aggregates indicate these rested sides cover the spread at a 58 percent clip over the past four campaigns. Conversely, teams arriving after a Sunday-Monday back-to-back on the continent show elevated foul rates in the second half, which inflates opponent free-throw attempts and pushes totals above the closing line more often than projected. Such tendencies remain consistent even after accounting for opponent strength and travel distance.
Integrating Metrics into Wager Construction
Sharp bettors combine publicly available rest data with proprietary recovery indicators leaked through team media channels or aggregated from multiple sources. They isolate games where one club posts superior average readiness scores yet sits as an underdog because oddsmakers emphasize recent form or head-to-head results. In May 2026 the playoff schedule features extended breaks between best-of-five series, creating additional spots where rested teams have historically increased their margin of victory by three points or more. Position sizing adjusts accordingly, with larger stakes reserved for contests displaying both statistical and schedule alignment.

Live betting markets also react to in-game fatigue signals once early-quarter data reveals slower transition defense or declining shooting percentages from the less-rested side. Observers who monitor real-time player-tracking feeds can identify when a squad’s average sprint speed drops below its season norm, prompting wagers on the opposing team’s next possession or quarter totals. These micro-edges compound when layered with pre-game rest differentials already baked into the opening line.
External Data Sources and Validation
Research conducted through the Australian Institute of Sport on elite basketball populations confirms that 72-hour recovery windows improve countermovement jump height by an average of 2.8 percent, a metric tied directly to rebounding and shot-blocking output. Similar patterns surface in EuroLeague-specific studies published by academic partners across the continent. Bettors reference these findings when constructing season-long models that weight rest days more heavily than traditional pace statistics alone.
Official league portals such as EuroLeague Basketball release weekly load-management summaries that further refine these calculations. Cross-checking those reports against injury designations and travel itineraries produces a clearer picture of which sides enter each round with genuine physical advantages rather than perceived momentum.
Conclusion
Recovery metrics now sit alongside traditional box-score indicators as essential inputs for EuroLeague wager evaluation. Teams that convert rest days into measurable readiness gains continue to generate edges that closing lines only partially capture. Systematic tracking of heart-rate variability, sleep patterns and schedule density allows for repeated identification of mispriced markets throughout the regular season and into the 2026 postseason cycle.