Seasonal Variance in Scoring Averages and Its Impact on Prop Bets During NBA Regular Season Transitions
Viktor Lehmann · Jul 22, 2026
Seasonal Variance in Scoring Averages and Its Impact on Prop Bets During NBA Regular Season Transitions
Scoring averages in the NBA shift noticeably across the regular season, and these changes create measurable effects on player prop bets that focus on points, rebounds, and assists. Data collected over multiple seasons shows that teams and individuals post different outputs in October and November compared with February and March, while transitions around the All-Star break and the post-Christmas schedule often mark the clearest inflection points. Observers note that prop bet markets adjust slowly to these patterns, which leaves room for systematic analysis based on historical monthly splits.
Monthly Scoring Patterns Across Recent Seasons
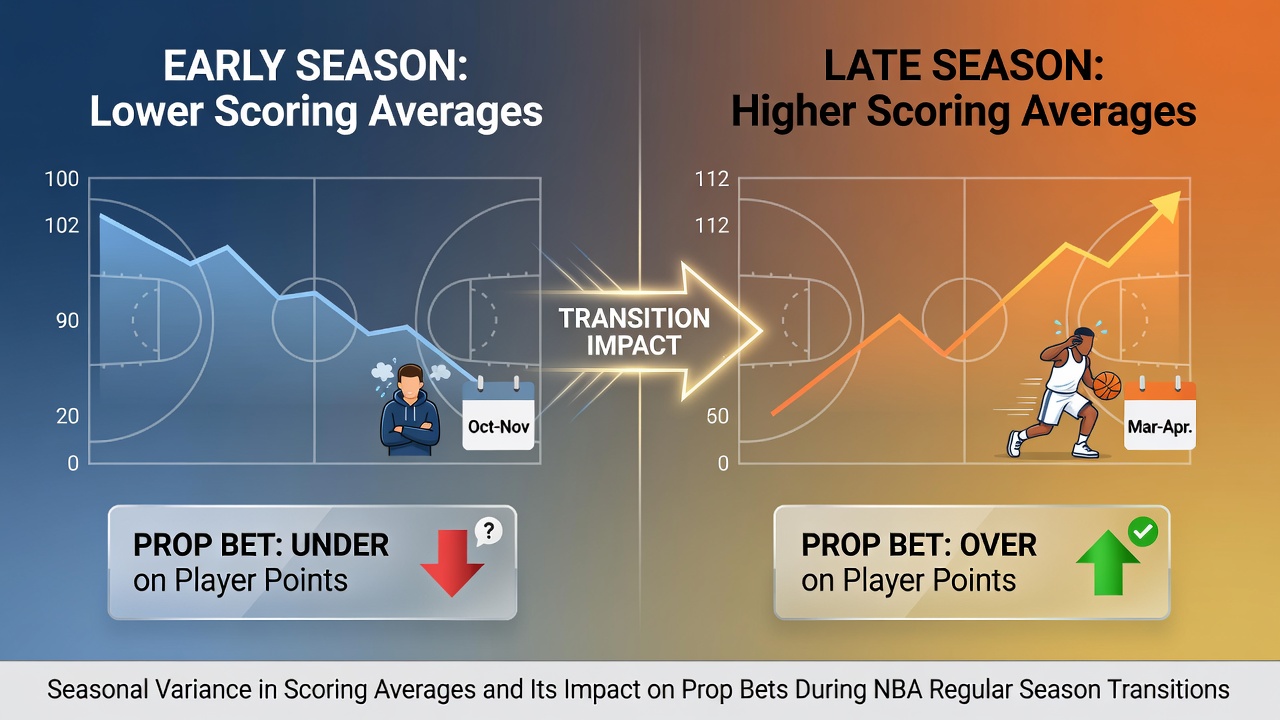
League-wide points per game climb from the opening month and then settle into a mid-season plateau before rising again in the final stretch. According to figures released by the National Basketball Association, scoring in October typically sits 3 to 5 points below the season-long average, largely because of compressed training camps and travel-heavy early schedules. By December the numbers stabilize, yet the period after the All-Star break frequently produces another spike as playoff positioning intensifies and rest management changes. Researchers tracking box-score data have documented that individual player scoring variance follows a similar arc, with guards and wings showing the largest month-to-month swings.
Factors Driving the Shifts
Travel distance, back-to-back games, and rest allocation all contribute to the observed variance. Teams play fewer than five back-to-backs in October, yet that number doubles by March, and data from Basketball Reference confirms that players average fewer minutes on the second night of such sets. In addition, the strength of schedule metric published by the league reveals that early-season opponents often rank lower in defensive efficiency, which temporarily inflates scoring before tougher matchups arrive after the new year. Injuries also cluster around the holiday period, further altering usage rates for remaining rotation members.
What's interesting is how these elements interact during specific transitions. The move from the pre-Christmas slate into the January grind coincides with a measurable dip in three-point volume league-wide, while the February-to-March window shows an uptick in paint touches as teams emphasize interior play ahead of postseason seeding battles. Prop bettors who examine rolling 15-game segments rather than full-season averages capture these adjustments more accurately.
Effects on Common Prop Bet Markets
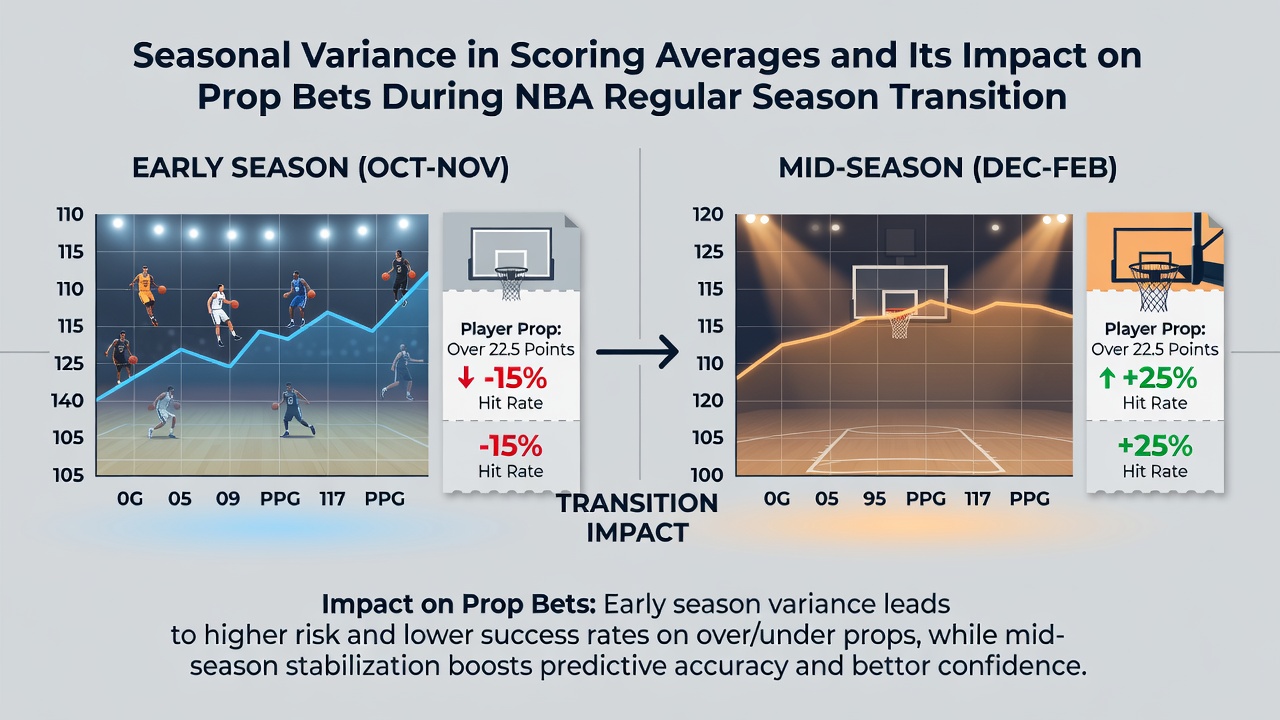
Player points props represent the most sensitive category because monthly scoring changes directly alter expected distributions. Historical splits indicate that forwards who average 18 points in the first two months often see that figure rise to 21 after the All-Star break when usage increases. Assist props for point guards follow a parallel pattern tied to pace changes, while rebound props for bigs remain steadier yet still vary with defensive scheme adjustments that occur around trade deadlines. Sportsbooks publish lines based on season-long or recent-form data, yet the lag in incorporating monthly splits creates discrepancies that statistical models can identify.
Over-and-under totals for team points also reflect seasonal variance. Early-season games produce lower totals on average, whereas March contests trend higher once defensive intensity rises and foul rates increase. A study conducted by analysts at the University of British Columbia examined five seasons of play-by-play data and found that the probability of a game exceeding the posted total shifts by roughly 6 percentage points between November and March. Bettors who adjust their models for these transitions gain an edge when lines remain anchored to earlier benchmarks.
Practical Applications During Key Transitions
The start of the season offers the clearest window for under-props because training-camp injuries and unfamiliar rotations suppress scoring. By contrast, the stretch run rewards over-props on players whose minutes stabilize after the trade deadline. July 2026 off-season projections already incorporate these historical patterns when oddsmakers release early futures markets for the 2026-27 campaign, allowing bettors to compare projected monthly splits against current lines. The same data sets also inform live-betting strategies once the regular season begins, because in-game pace metrics often mirror the seasonal trends observed in prior years.
Conclusion
Seasonal variance in NBA scoring averages produces predictable shifts that affect prop bet outcomes at multiple points during the regular season. Monthly data compiled by the league and independent researchers demonstrates consistent patterns tied to schedule density, rest, and competitive context. Those who monitor transitions around Christmas, the All-Star break, and the trade deadline can align their prop selections with documented scoring tendencies rather than static season averages. As the 2026-27 campaign approaches, updated historical splits will continue to shape both pre-season projections and in-season adjustments.